In today’s rapidly evolving world, renewable energy sources are becoming increasingly crucial in our fight against climate change. From solar panels to wind turbines, this article delves into the advancements and challenges faced by the renewable energy sector. We’ll explore the latest technologies, government policies, and how individuals can contribute to a more sustainable future.
Solana (SOL) has been on a rollercoaster ride over the past few months, with the cryptocurrency experiencing significant volatility and price swings. Starting with the 120-day period from November 27th, 2023 to March 25th, 2024, SOL kicked off at $55.05 and embarked on a steady climb, reaching a local high of $120.90 on December 25th. Notably, SOL’s uptrend accelerated in mid-March, with the price skyrocketing to an all-time high of $201.85 by March 17th. However, the euphoria was short-lived as the cryptocurrency experienced a sharp correction, plummeting to the $172-$188 range in the final week of the analyzed period. Despite the pullback, the long-term trend appears to remain bullish, with investors keenly watching key Fibonacci retracement levels at $130, $101, and $84 for potential entry opportunities.
Summary:
Solana (SOL) has experienced significant volatility and price swings over the past few months. The 120-day analysis shows an impressive uptrend, with SOL reaching an all-time high of $201.85 on March 17th, followed by a sharp correction. The 40-day period confirms the bullish sentiment, with indicators suggesting potential oversold conditions during the pullback. The 3-day timeframe displays an overall uptrend, with the Stochastic RSI and OBV indicating strong bullish momentum. Despite the recent pullback, the overall trend remains positive, with key support levels to watch for potential entry opportunities.
Solana (SOL) has been on a rollercoaster ride over the past few months, with the cryptocurrency experiencing significant volatility and price swings. In this technical analysis, we’ll take a closer look at SOL’s performance over the last 120 days, 40 days, and 3 days to gauge the current market sentiment and potential future price action.
Starting with the 120-day period from November 27th, 2023 to March 25th, 2024, SOL kicked off at $55.05 and embarked on a steady climb, reaching a local high of $120.90 on December 25th. The On-Balance Volume (OBV) indicator confirmed the bullish price action, rising from 0 to 134,428k. Interestingly, after a brief consolidation period in the $83-$110 range, SOL resumed its upward trajectory, hitting $116.98 in mid-February. The Stochastic RSI indicated overbought conditions, while OBV reached new highs, further validating the bullish sentiment.
Notably, SOL’s uptrend accelerated in mid-March, with the price skyrocketing to an all-time high of $201.85 by March 17th. However, the euphoria was short-lived as the cryptocurrency experienced a sharp correction, plummeting to the $172-$188 range in the final week of the analyzed period. Despite the pullback, the long-term trend appears to remain bullish, with investors keenly watching key Fibonacci retracement levels at $130, $101, and $84 for potential entry opportunities.
Zooming in to the 40-day period from February 15th to March 25th, 2024, SOL continued its impressive uptrend, starting at $113.51 and reaching a peak of $201.85 on March 17th. The Stochastic RSI suggested overbought conditions around March 14th-15th, coinciding with the price peak. Surprisingly, the subsequent decline in the indicator to 6.42 on March 23rd signaled an oversold market, preceding a price recovery towards the end of the period.
The OBV indicator painted a similar picture, with a steady increase from -41,514.4k on February 23rd to a high of 144,733k on March 15th, indicating strong buying pressure. However, the OBV declined to 84,934.9k by March 23rd, suggesting selling pressure during the pullback. Interestingly, the price found support near the 0.5 Fibonacci level ($150.87) during the correction, hinting at a potential significant support area.
Finally, focusing on the 3-day timeframe from March 22nd to March 25th, 2024, SOL displayed an overall uptrend, starting at $172.95 and reaching $188.44, despite some fluctuations. The Stochastic RSI climbed from oversold territory to overbought levels, indicating strong bullish momentum. Similarly, the OBV turned positive on March 24th and continued to increase, confirming the bullish price action and suggesting further upside potential.
In conclusion, Solana’s technical analysis paints a bullish picture across the 120-day, 40-day, and 3-day timeframes. Despite the recent pullback, the overall trend remains positive, with key indicators suggesting a potential continuation of the uptrend. However, investors should keep a close eye on crucial support levels and be prepared for short-term volatility. As always, prudent risk management and a long-term perspective are essential when navigating the dynamic cryptocurrency market.
Ethereum (ETH) has been on a rollercoaster ride over the past few months, with the cryptocurrency experiencing significant volatility across different time frames. Looking at the 120-day chart, we can see that ETH has been in a strong uptrend since late November 2023, with the price more than doubling from $2,027.58 to a high of $4,064.95 by March 11th, 2024. Interestingly, the Stochastic RSI oscillator provided some useful signals along the way, with oversold readings in late December and late January preceding price rallies, while overbought readings in mid-February and early March preceded pullbacks. The OBV indicator also trended higher alongside price, confirming the bullish trend. However, the sharp decline in March and weakening OBV suggest that the uptrend may be losing steam.
Summary:
Ethereum (ETH) has experienced significant volatility recently. The 120-day chart shows a strong uptrend since late November, with the price more than doubling, but signs of the uptrend losing steam. The 40-day chart reveals a rally from mid-February to early March, followed by a pullback finding support around $3,300. The 3-day chart indicates a potential near-term pullback or consolidation, with key resistance levels around $3,433 and $3,475. While the long-term trend appears bullish, the short-term outlook is somewhat bearish based on indicators. Investors should monitor price action around key Fibonacci levels to gauge the market’s directional bias.
Ethereum (ETH) has been on a rollercoaster ride over the past few months, with the cryptocurrency experiencing significant volatility across different time frames. Let’s dive into the technical analysis to see what the charts are telling us about ETH’s potential future price movements.
Looking at the 120-day chart, we can see that ETH has been in a strong uptrend since late November 2023, with the price more than doubling from $2,027.58 to a high of $4,064.95 by March 11th, 2024. Interestingly, the Stochastic RSI oscillator provided some useful signals along the way, with oversold readings in late December and late January preceding price rallies, while overbought readings in mid-February and early March preceded pullbacks.
The OBV indicator also trended higher alongside price, confirming the bullish trend. However, the sharp decline in March and weakening OBV suggest that the uptrend may be losing steam. Notably, the price found support near the 23.6% Fibonacci retracement level at $3,336.47 during the March decline. If ETH can hold above this key support level, the longer-term uptrend may remain intact. However, a sustained move below this level could signal a deeper correction on the horizon.
Zooming in to the 40-day chart, we can see the strong uptrend in more detail, with ETH rallying from $2,822.68 on February 15th to a high of $4,064.95 on March 11th. The price then pulled back, finding support around the $3,300 level in the second half of March. The Stochastic RSI bottomed near 0 on March 16th, coinciding with a local price low, but has stayed below the key 80 level, indicating that the uptrend may not be firmly reestablished yet.
The OBV indicator shows a steady rise from mid-February to early March, confirming the uptrend, but has pulled back with price while remaining well above its February levels. This suggests that overall buying pressure is still intact. Surprisingly, the 38.2% Fibonacci retracement level around $3,300 has provided strong support during the pullback. A sustained break below this level would suggest a deeper correction is unfolding.
For the bullish case to remain intact, ETH should ideally hold above the $3,300-$3,500 support zone. A breakout to new highs would signal the next leg up is underway. Conversely, a breakdown below support would warn of a potential trend change.
Finally, looking at the 3-day chart, we can see that ETH has been trading in a range between $3,287 and $3,489 over the past few days. The price did stage an impressive rally from $3,308 to $3,489 on March 24-25, but the Stochastic RSI suggests it may have been overextended. Prices were rejected at key Fibonacci resistance levels and OBV remains negative overall.
This points to a potential pullback or consolidation in the near-term, with $3,433 and $3,475 acting as key resistance levels to watch. A decisive break above $3,489 would be needed to signal a continuation of the uptrend. Conversely, a drop below the $3,287-$3,308 support zone would indicate further downside is likely.
In conclusion, while the long-term trend for ETH appears bullish, the short-term outlook is somewhat bearish based on the indicators. However, the March 24-25 rally shows that bulls are still active. More confirmation is needed before a clear direction can be determined. Investors should monitor price action around key Fibonacci levels to gauge the market’s directional bias going forward. Nimble traders can look to play the range between support and resistance until a breakout occurs. As always, risk management is crucial in this volatile market.
Bitcoin’s price action over the last 120 days has been a rollercoaster ride for investors. Starting around $37,000 in late November 2023, the price rallied strongly, nearly doubling to reach a high around $73,000 in early February 2024. However, after this impressive run, the price began to lose steam, retracing to around $50,000 by late February before attempting another rally to retest the highs in early March. Interestingly, this second high was slightly lower, forming a potential double top pattern that often precedes a trend reversal. Since that second peak, Bitcoin has been trending down, falling to around $66,000 by late March 2024, a decline of about 10% from the highs. The Stochastic RSI, which spent much of December and January in overbought territory above 80 as the price rallied, has since fallen, ending the period at 19.84 and suggesting waning bullish momentum.
Summary:
Bitcoin’s price experienced a rollercoaster ride over the past 120 days, rallying from around $37,000 to nearly $73,000 before retracing to around $66,000 by late March 2024. The OBV indicator suggests underlying buying pressure remains intact, despite the recent pullback. Key Fibonacci retracement levels to watch are $64,400 (0.236) and $59,500 (0.382) from the November-February rally. In the short-term, a break above $67,209 could signal continued bullish momentum, while a decline below $64,446 (61.8% Fibonacci) may indicate a deeper correction. Overall, the technical picture remains bullish if Bitcoin holds above key support levels.
Bitcoin’s price action over the last 120 days has been a rollercoaster ride for investors. Starting around $37,000 in late November 2023, the price rallied strongly, nearly doubling to reach a high around $73,000 in early February 2024. However, after this impressive run, the price began to lose steam, retracing to around $50,000 by late February before attempting another rally to retest the highs in early March. Interestingly, this second high was slightly lower, forming a potential double top pattern that often precedes a trend reversal.
Since that second peak, Bitcoin has been trending down, falling to around $66,000 by late March 2024, a decline of about 10% from the highs. The Stochastic RSI, which spent much of December and January in overbought territory above 80 as the price rallied, has since fallen, ending the period at 19.84 and suggesting waning bullish momentum.
Notably, the OBV indicator, which rose steadily from November to February and confirmed the bullish price action, has not turned down significantly with the recent price declines. This suggests that the underlying buying pressure may still be intact, and buyers could step in to support the price.
Looking at the Fibonacci retracement levels drawn from the November low to February high, the price bounced right at the 0.382 retracement level around $59,500 in late February and is currently testing the 0.236 level around $64,400. A decisive break below this level would suggest a deeper pullback is likely, with the next support at the 0.382 level again.
Zooming into the last 40 days from February 15th to March 25th, 2024, we see Bitcoin started around $51,880 and trended mostly sideways until February 26th. From there, the price broke out sharply to the upside, rallying over 40% to a high of $73,074 by March 13th. However, the price then reversed course and declined back to around $66,859 by the end of the period.
Interestingly, the OBV indicator showed very strong positive divergence from the price during the February consolidation phase, foreshadowing the major rally that followed. OBV continued making new highs even as the price advance stalled in mid-March, indicating underlying buying pressure remained intact. This bullish OBV divergence suggests the pullback may prove to be a healthy correction and consolidation within a larger uptrend.
The Fibonacci retracement levels drawn from the rally from $50,745 to $73,074 show the pullback retraced about 50% of that up move, finding support right around the key 0.5 Fibonacci level near $62,000. Holding above this level keeps the overall technical picture bullish.
Finally, looking at the most recent 3-day period from March 22nd to March 25th, 2024, we see Bitcoin’s price started at $64,261.40 and initially trended downwards before recovering. It then moved higher, reaching $65,659.80, with the Stochastic RSI moving into overbought territory. However, a sharp reversal followed, with the price declining to a low of $63,991.50.
The price then bounced and trended higher again, peaking at $67,209.80 before pulling back slightly. Throughout this period, the OBV indicator initially declined but then started rising, suggesting increasing buying volume supporting the upward price movement.
Key Fibonacci retracement levels to watch based on the move from the $62,740.60 low to the $67,209.80 high are $66,154.21 (23.6%), $65,503.42 (38.2%), $64,975.20 (50%), and $64,446.98 (61.8%).
In conclusion, while the strong uptrend from November to February was very bullish, the recent price action suggests the rally may be losing steam. However, the still strong OBV line suggests that buyers may step in to support the price. If Bitcoin can hold above the key Fibonacci levels, the medium-term uptrend could still be intact for a potential move higher. But a decisive break below these levels would open the door to a deeper pullback.
In the short-term, traders should watch for a sustained break above the March 24th high at $67,209.80 for confirmation of continued bullish momentum, or a decline below the 61.8% Fibonacci level at $64,446.98, which would suggest a deeper correction is unfolding. The 50% retracement level at $64,975.20 is a key pivot point to watch. As always, investors and traders should use a combination of technical and fundamental analysis and employ proper risk management strategies when making investment decisions.
In the last few months, Solana (SOL) has demonstrated a volatile yet upward trajectory, breaking through resistance levels and occasionally falling back to test support within designated ranges. Notably, the asset showcased significant price movements and trading volumes, indicating strong buying and selling pressures at various points. The recent analysis reveals a bullish momentum, with the RSI currently standing at 70.96, suggesting that Solana might be entering overbought territory. This analysis aims to dissect Solana’s price action over different time frames, providing insights into its potential future movements.
Solana’s journey over the past 120 days has been nothing short of a rollercoaster, marked by significant price movements and volume changes. Starting in November 2023, Solana traded below the green range at $41.15, gradually climbing into the blue range by December, showcasing a strong buying interest. The asset peaked at $112.45 in December, indicating peak interest in Solana. However, it experienced a dramatic drop in January 2024, falling to $91.09, before making a notable recovery. In the last 40 days, Solana’s price story became even more volatile, with significant price movements and trading volumes. Starting at $93.58 in January 2024, it faced a notable sell-off, dropping below the Green Range to $83.64. Despite the fluctuations, Solana managed to climb back, peaking at $115.66 within the Orange Range in February. This period was marked by a recovery from previous drops but showcased the asset’s volatility. The last 3 days have been particularly dynamic for Solana, with the price moving through different ranges and marked by significant volume spikes. Starting at $109.18, Solana experienced a surge to $114.23, breaking above the blue range. It then entered the orange range, peaking at $115.14, before closing the period at $117.49, above the orange range. This short period highlighted Solana’s resilience and strong buying interest. Throughout these periods, Solana demonstrated a volatile yet upward trajectory, breaking through resistance levels and occasionally falling back to test support within the designated ranges. The volume spikes accompanying significant price changes highlight moments of heightened trading activity, reflecting the market’s reaction to evolving dynamics. The current RSI value of 70.96 suggests that Solana might be entering overbought territory, which could lead to a potential pullback. However, the asset’s ability to recover and push through resistance levels indicates a bullish sentiment among investors.
In conclusion, Solana’s recent performance showcases its volatility and the significant impact of trading volumes on its price movements. While the current bullish momentum is strong, investors should be cautious of potential overbought conditions. Stay updated with our future analyses to navigate the ever-changing landscape of cryptocurrency markets. Your thoughts on Solana’s future performance are welcome in the comments section below.
In the ever-evolving landscape of cryptocurrency markets, Ripple (XRP) has showcased a remarkable journey of resilience amidst volatility. Over the last 120 days, Ripple’s price has navigated through significant fluctuations, breaking above resistance levels and dipping below support levels, with trading volumes closely mirroring these pivotal movements. The recent analysis reveals a dynamic interplay between buyer interest and selling pressure, highlighting Ripple’s ability to recover from dips and surge above established ranges. This article delves into the technical analysis of Ripple’s price movements, offering insights into its performance across different time frames.
The story of Ripple (XRP) over the last few months is a testament to the cryptocurrency’s resilience in the face of market volatility. Starting with a 120-day analysis, Ripple’s journey from trading within established ranges to breaking above resistance levels is noteworthy.
Initially, Ripple showcased strong buying interest, pushing its price beyond upper resistance levels, only to see a significant sell-off bring it back within range. This pattern of volatility continued, with Ripple experiencing a notable recovery in February 2024, indicating a bullish momentum that reclaimed lost ground. Moving to a more granular 40-day analysis, Ripple’s price fluctuations within and across primary ranges highlight its volatile yet resilient nature.
The asset demonstrated its ability to recover from dips below support levels, with trading volumes playing a crucial role in signaling strong buying or selling pressure. This period was characterized by resilience, as Ripple managed to break resistance levels and consolidate its position within established ranges. The most recent 3-day analysis provides a snapshot of Ripple’s dynamic trading period, marked by rapid shifts in momentum.
Significant volumes accompanied surges above resistance levels and drops below support levels, reflecting the market’s reactive nature to both bullish and bearish signals. This period saw Ripple demonstrating volatility, with traders reacting quickly to market movements, leading to a series of breakouts and breakdowns. Overall, Ripple’s performance over these varying time frames paints a picture of a cryptocurrency navigating through market volatility with resilience. The asset’s ability to recover from dips, coupled with its response to buyer interest and selling pressure, underscores the dynamic nature of cryptocurrency markets. As we look to the future, keeping an eye on Ripple’s trading volumes and price movements within established ranges will be key to understanding its market position. Stay updated with our future analyses to gain more insights into Ripple’s performance and potential market trends.
In a remarkable journey over the last 120 days, Ethereum has showcased a bullish trend, breaking through multiple resistance levels with significant volume spikes. The recent analysis reveals Ethereum’s dynamic price movements, from struggling below the green range to soaring above the orange range, marking a peak at $3374.17. This upward trajectory is supported by a strong buying interest, as evidenced by the volume and RSI indicators. The last 40 days have seen Ethereum overcoming sharp declines, demonstrating resilience and an ability to recover and break out above higher ranges. The last 3 days have been particularly volatile, with Ethereum testing support and resistance levels, indicating the market’s reactive nature.
Ethereum’s price analysis over the last 120 days reveals a bullish momentum, with the cryptocurrency breaking through key resistance levels and reaching new highs. Starting below the green range, Ethereum quickly gained traction, moving into and above the green and blue ranges, eventually breaking above the orange range with significant volume spikes. This suggests a strong bullish sentiment among traders and investors, driving up the price significantly. ![120 Days Analysis] In the more granular view of the last 40 days, Ethereum demonstrated significant volatility but managed to recover from sharp declines, showcasing resilience. The asset broke above the green and blue ranges, indicating strong buying interest and bullish momentum. This period was marked by crucial moments of resistance breakouts and support level tests, underscoring the dynamic nature of the cryptocurrency markets. ![40 Days Analysis] The last 3 days have been particularly volatile for Ethereum, with the asset testing support and resistance levels within the Green and Blue ranges. Significant volume spikes correlated with key price movements, highlighting the market’s reactive nature to these predefined ranges. Despite a sharp correction, Ethereum managed to recover, closing slightly above the Blue range. This period showcases Ethereum’s volatility and the traders’ quick reactions to market movements. ![3 Days Analysis] Overall, Ethereum’s performance over these periods paints a picture of a cryptocurrency with strong bullish momentum, capable of overcoming volatility and resistance levels. The RSI values, particularly the high of 84.32 in the 120-day analysis, indicate overbought conditions, suggesting that Ethereum has been in high demand. However, traders should be cautious of potential corrections following such rapid ascents.
Stay updated with our future analyses to navigate the ever-evolving cryptocurrency market. Share your thoughts on Ethereum’s future performance and engage with our community for more insights.
in the latest price analysis, Bitcoin (BTC) has shown an impressive surge, breaking through multiple resistance levels with significant trading volumes backing each move. Starting from a modest $35,421.4 in November 2023, BTC has climbed to a staggering $63,690.1 by February 2024. This journey was marked by a series of bullish breakouts, each supported by increased trading activity, suggesting strong buyer interest. Notably, the RSI readings have reached extreme levels, indicating a highly overbought market condition. This analysis delves into the details of Bitcoin’s recent price action, exploring the dynamics behind its rise and what traders might expect next.
Bitcoin’s journey over the last 120 days has been nothing short of spectacular. Starting in the green range with a modest price, it quickly gained momentum, breaking through resistance levels with ease. The RSI, peaking at an astonishing 87.25, signals a market that’s potentially overbought but still bullish. ![120 Days Analysis]
Zooming into the last 40 days, we see Bitcoin’s resilience and bullish sentiment continue. The price not only sustained its upward trajectory but also showed significant volatility, with the RSI reaching a jaw-dropping 90.8. This period was characterized by sharp price movements and high trading volumes, indicating a strong market interest. ![40 Days Analysis]
The most recent 3-day analysis reveals a market still in the grips of volatility, with the RSI at a more moderate 64.7. Despite this, Bitcoin’s price action remained aggressive, breaking through the blue range with substantial volume. This short-term view provides a glimpse into the ongoing bullish sentiment and market dynamics at play. ![3 Days Analysis]
In conclusion, Bitcoin’s performance over these periods has been exemplary, showcasing a strong bullish trend backed by significant trading volumes. The RSI levels, while indicating overbought conditions, have not deterred the market’s upward momentum. Looking ahead, while caution is advised due to the extreme RSI readings, the market’s strength cannot be underestimated. Traders should stay tuned for further analyses and updates on Bitcoin’s price action. Your thoughts on Bitcoin’s future performance are welcome in the comments below.
Bitcoin’s journey over the past few months has been nothing short of spectacular, showcasing volatility and resilience that has left investors and traders on the edge of their seats. Starting from the last 120 days, we’ve seen Bitcoin’s price gradually climb from the mid-$34,000 range, breaking through the $40,000 and $50,000 barriers, and peaking at over $52,000. This bullish trend is supported by the moving averages, which, despite starting with ‘nan’ values due to the calculation period, began to show a clear upward trajectory as the 50-day moving average crossed above the $40,000 mark, indicating strong buying pressure and investor confidence.
Zooming into the last 40 days with a 4-hour interval, the granularity of the data reveals more about Bitcoin’s short-term volatility and the resilience of its upward trend. Despite minor pullbacks, the overall direction remained bullish, with the moving averages providing support levels that Bitcoin’s price consistently bounced off from. The introduction of the 200-day moving average in this timeframe offers a broader perspective on the market sentiment, which remains positive as the price stays well above this long-term indicator.
The last 3 days, observed at a 15-minute interval, present a microcosm of Bitcoin’s volatile nature. Short-term fluctuations are evident, with the price oscillating around the $51,000 mark. However, the moving average indicates a slight upward trend, suggesting that the bullish momentum might still be in play. This period’s RSI, hovering around the mid-50s, indicates neither overbought nor oversold conditions, suggesting a balanced market sentiment.
In summary, Bitcoin’s performance over the analyzed periods paints a picture of a cryptocurrency on the rise, breaking through key resistance levels and showing signs of sustained bullish momentum. While the market remains volatile, the underlying trend suggests that Bitcoin could continue its upward trajectory. Investors and traders should keep a close eye on moving averages and RSI levels for signs of potential reversals or continuation of the trend. Stay updated with our analyses for more insights into where Bitcoin could be headed next. Your thoughts on Bitcoin’s future performance are welcome in the comments below.
Strengthened dollar and high U.S. inflation fears prompt oil price decline, complicating rate cut expectations.
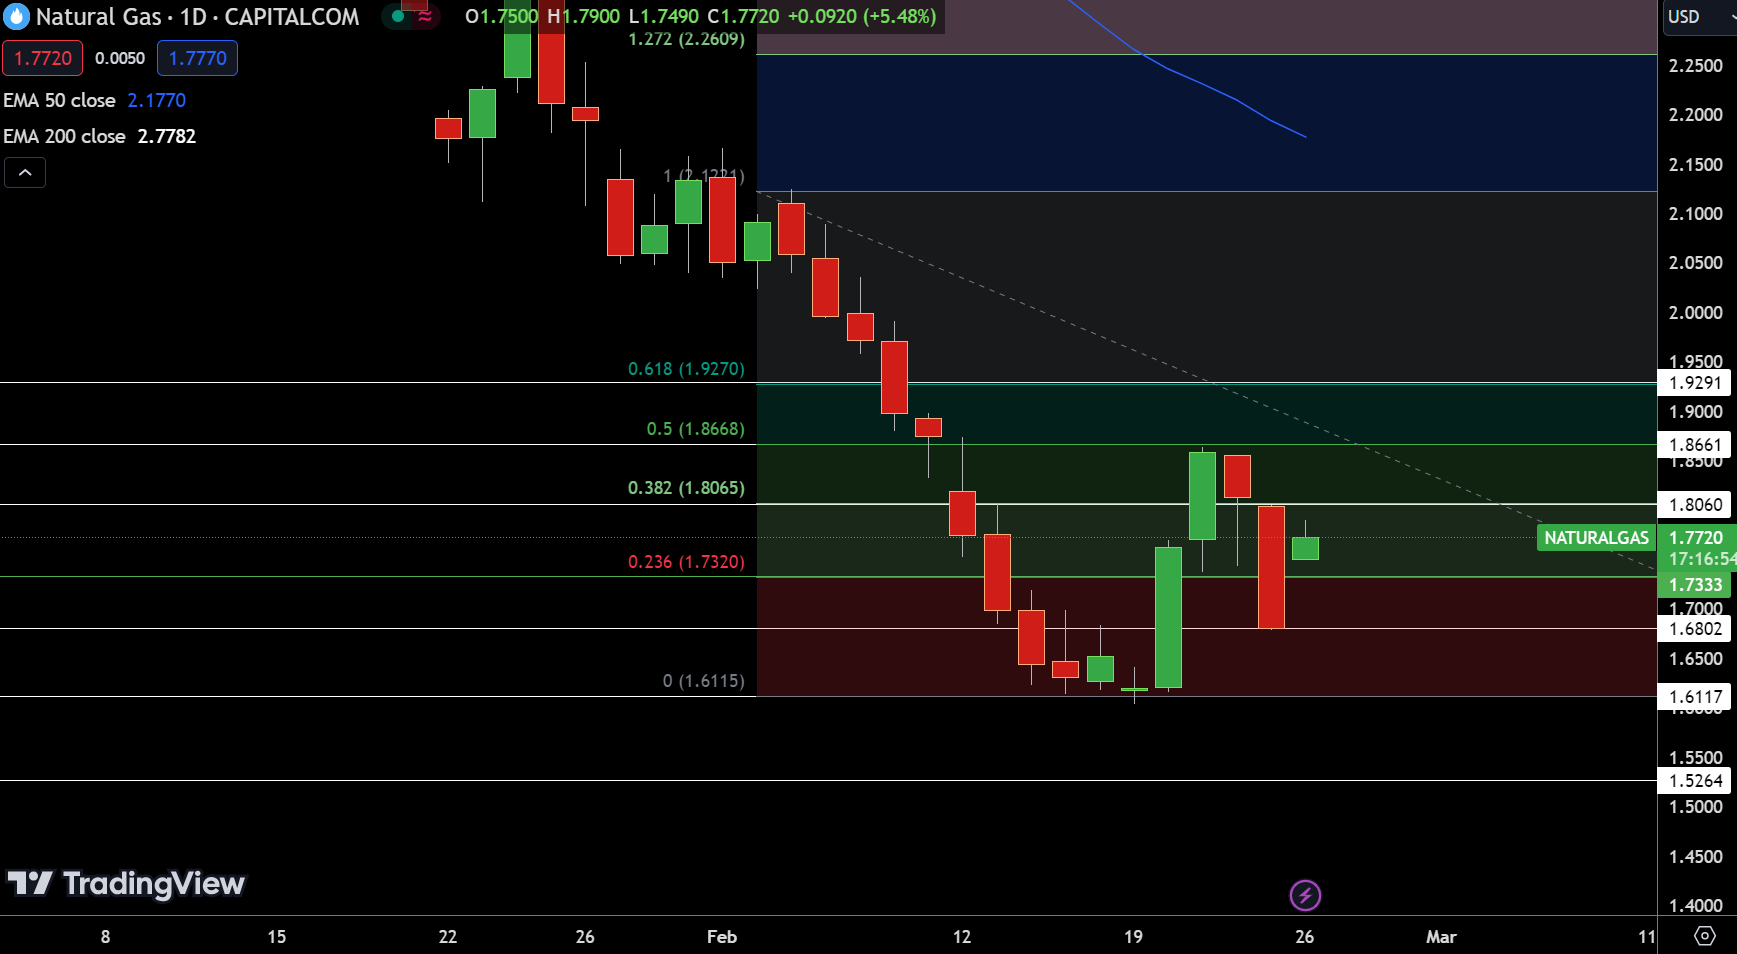
Natural Gas surges 5.65% to $1.7760, bullish above pivot point $1.7333, with resistance up to $1.9291.
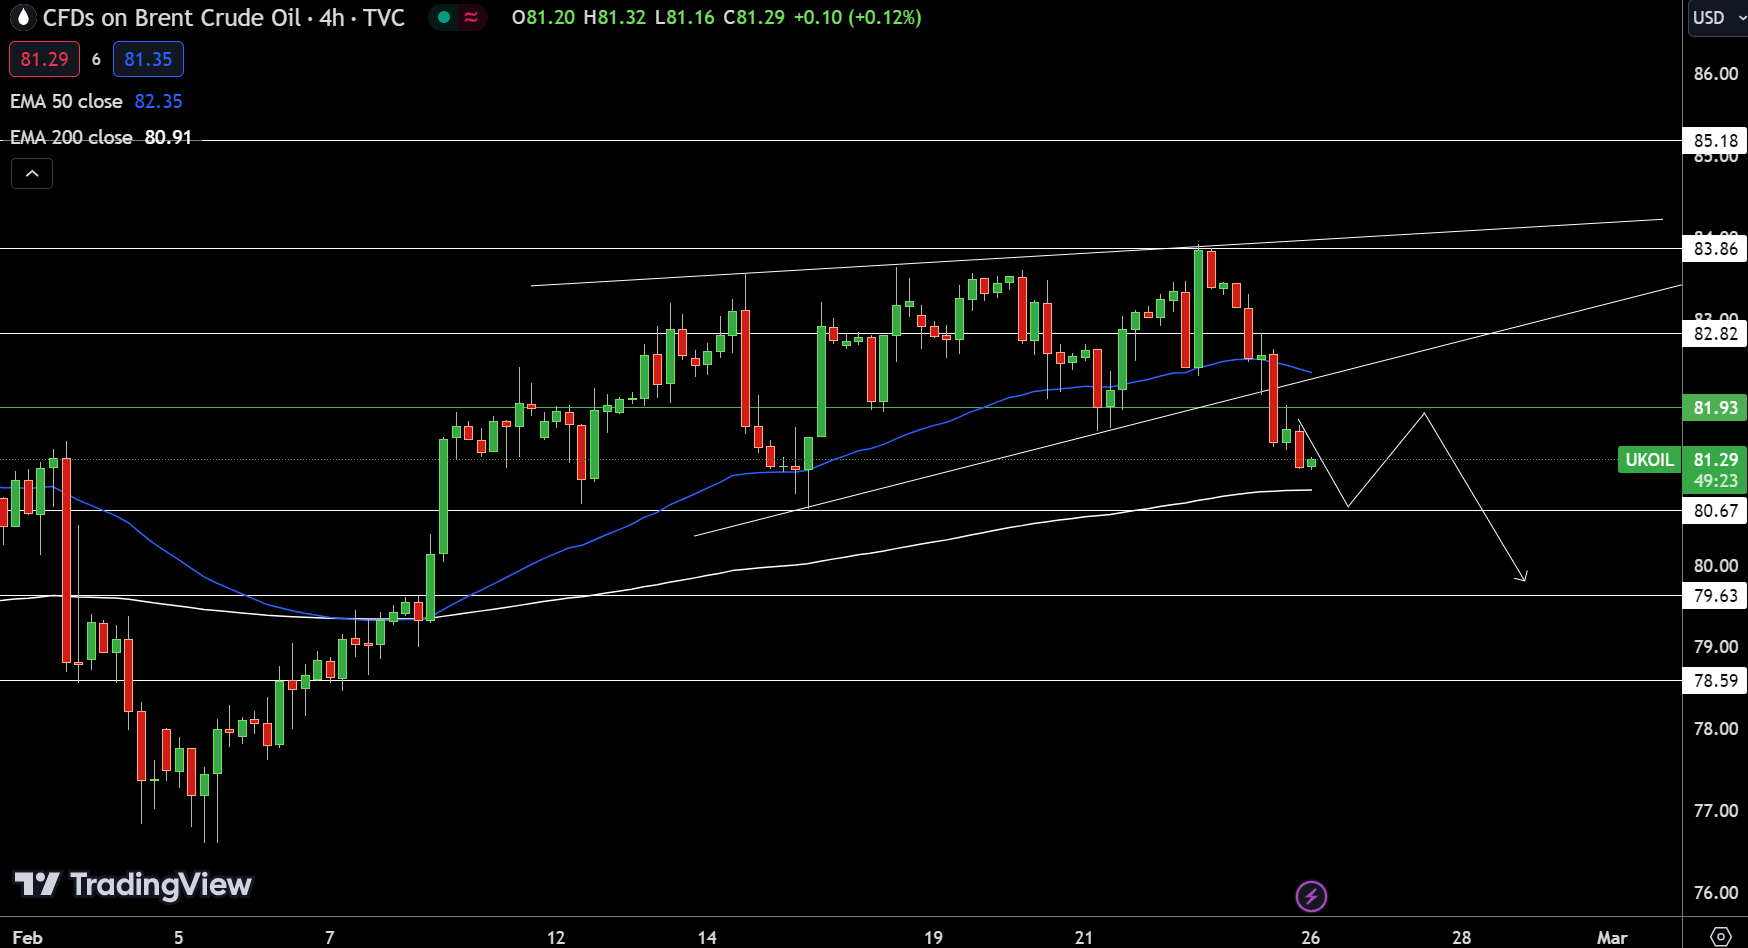
UK Oil dips to $81.30, bearish below pivot $81.93, despite potential support at $80.67 and lower.
In this article:
Natural Gas
-0.40%
WTI Oil
-0.36%
Brent Oil
-0.31%
Oil Dips as Strong Dollar and Rate Cut Speculations Weigh on Market
Oil prices saw a decline on Monday, continuing from the previous session’s drop as the dollar strengthened due to concerns that persistently high U.S. inflation might postpone anticipated cuts in U.S. interest rates. This fall in prices adds to the previous week’s downturn, driven by the likelihood of delayed U.S. rate cuts.
The stronger dollar, which makes oil more expensive for non-dollar currency holders, and a mix of geopolitical tensions and fluctuating demand forecasts, particularly from China, influenced the market.
Goldman Sachs has adjusted its peak summer price projection for Brent upwards, expecting a demand growth, notably from the U.S. and India, balanced against robust non-OPEC supply growth.
Meanwhile, geopolitical tensions and negotiations in the Middle East continue, with potential impacts on energy supplies and prices.
Natural Gas Price Forecast
Natural Gas Price ChartNatural Gas (NG) experienced a notable surge, climbing 5.65% to $1.7760 in today’s 4-hour trading session. This movement places NG above its pivot point at $1.7333, indicating bullish momentum. Resistance levels are identified at $1.8060, $1.8661, and $1.9291, marking potential targets for upward movement.
Conversely, support levels are established at $1.6802, followed by $1.6117 and $1.5264, which could offer stabilization in case of a retracement. The 50-day Exponential Moving Average (EMA) at $2.1770 and a much lower 200-day EMA at $0.54880 underscore the volatility and upward potential in NG prices.
The overall trend appears bullish above the $1.7333 mark, suggesting a continuation of the upward trajectory if this level holds.
WTI Oil Price Forecast
WTI Price Chart
USOIL has seen a downturn, currently trading at $76.14, marking a 0.53% decrease. In today’s 4-hour chart, the pivot point stands at $76.49, suggesting a nuanced battleground for buyers and sellers.
Resistance levels are set at $77.56, $78.89, and $80.10, indicating potential hurdles for upward movements. Conversely, support is found at $75.50, with further floors at $74.55 and $74.19, which could stabilize any declines. The 50-day Exponential Moving Average (EMA) at $77.22 and a notable 200-day EMA provide context for the current price action.
A breakout below the $76.50 level could signal a bearish trend, hinting at further declines if sustained. The technical outlook suggests a cautious approach, with a bearish sentiment prevailing below the pivot point of $76.49.
Brent Oil Price Forecast
UKOIL Price Chart
In today’s market review, UK OIL recorded a modest decline, trading at $81.30, reflecting a 0.44% decrease. The commodity’s movements within the four-hour chart frame have placed it just below the pivot point of $81.93.
Looking ahead, traders are eyeing resistance levels at $82.82, $83.86, and $85.18, which could cap potential rallies. Conversely, support is established at $80.67, with further downside protections at $79.63 and $78.59, suggesting a cushion for any extended drops.
The 50-day Exponential Moving Average (EMA) at $82.35 and the 200-day EMA at $80.91 indicate a narrow trading band. The technical outlook suggests a bearish trend if prices remain below the pivot point of $81.93, urging investors to watch this level closely for signs of direction.
For a look at all of today’s economic events, check out our economic calendar.
Investor Focus Will Return to the BTC-Spot ETF-Market and Flow Data
On Sunday, BTC rose by 0.31%. Following a 1.53% on Saturday, BTC ended the session at $51,697. BTC ended the week down 0.92% despite gains over the weekend.
There was no BTC-spot ETF market flow-related data for investors to consider. However, investors remained optimistic about the outlook for BTC-spot ETFs and the evolution of the crypto-spot ETF market.
Experts Trade Bitcoin with IC Markets
Trading Derivatives carries a high level of risk to your capital and you should only trade with money you can afford to lose. Trading Derivatives may not be suitable for all investors, so please ensure that you fully understand the risks involved, and seek independent advice if necessary. A Product Disclosure Statement (PDS) can be obtained either from this website or on request from our offices and should be considered before entering into a transaction with us. Raw Spread accounts offer spread
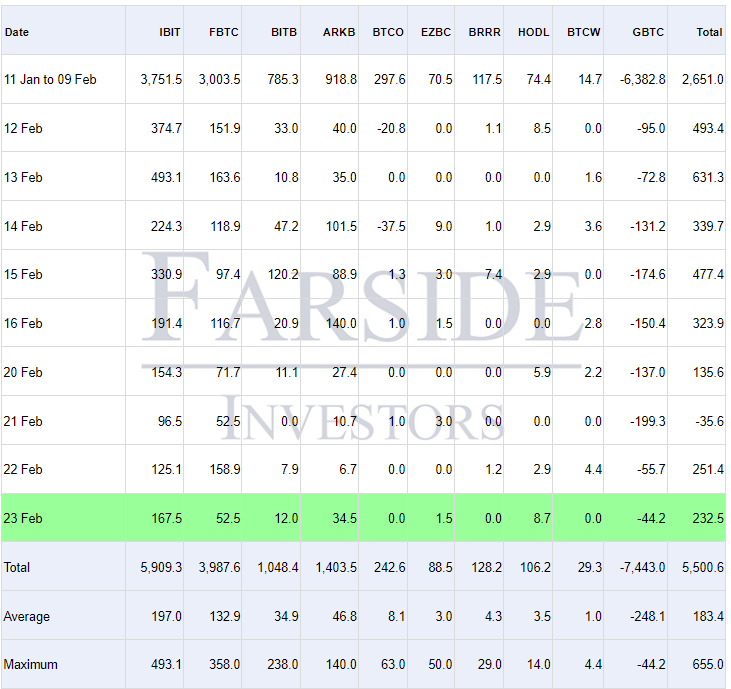
Downward trends in Grayscale Bitcoin Trust (GBTC) outflows resonated over the weekend. According to Farside Investors, GBTC recorded $44 million in net outflows on Friday, the lowest since January 11.
Farside Investors BTC-spot ETF Market Flows for 23/02/24
However, BTC-spot ETF market flow data for Monday, February 26, must improve to drive buyer demand for BTC. Flow data for iShares Bitcoin Trust (IBIT) and Fidelity Wise Origin Bitcoin Fund (FBTC) remain the focal points. Nonetheless, ARK 21Shares Bitcoin ETF (ARKB) and Bitwise Bitcoin ETF (BITB) must contribute to the BTC-spot ETF market for net inflows to return to $2 billion.
Beyond the crypto market, sentiment toward the timeline for a Fed rate cut may influence BTC-spot ETF market flows.
Fed Rate Cut Timelines and US Inflation May Influence BTC-Spot ETF Market Trends
Probabilities of the Fed cutting interest rates in March and May declined last week.
According to the CME FedWatch Tool, the probability of a 25-basis point Fed rate cut fell from 10.0% to 2.3% in the week ending February 23. Significantly, the chances of a 25-basis point May rate cut declined from 28.0% to 19.4% over the same period. The probability of a 50-basis point May rate cut declined from 2.3% to 0.6%.
From Tuesday (Feb 20) to Friday (Feb 23), the BTC-spot ETF market saw total net inflows of $573.5 million, down from $1,778 million of net inflows from Tuesday to Friday in the previous week.
US economic indicators could further influence BTC-spot ETF market flow trends this week. US Core Price Index numbers (Thurs) will likely impact the timeline of a Fed rate cut and the appetite for riskier assets.
ETH Outmuscles BTC in February
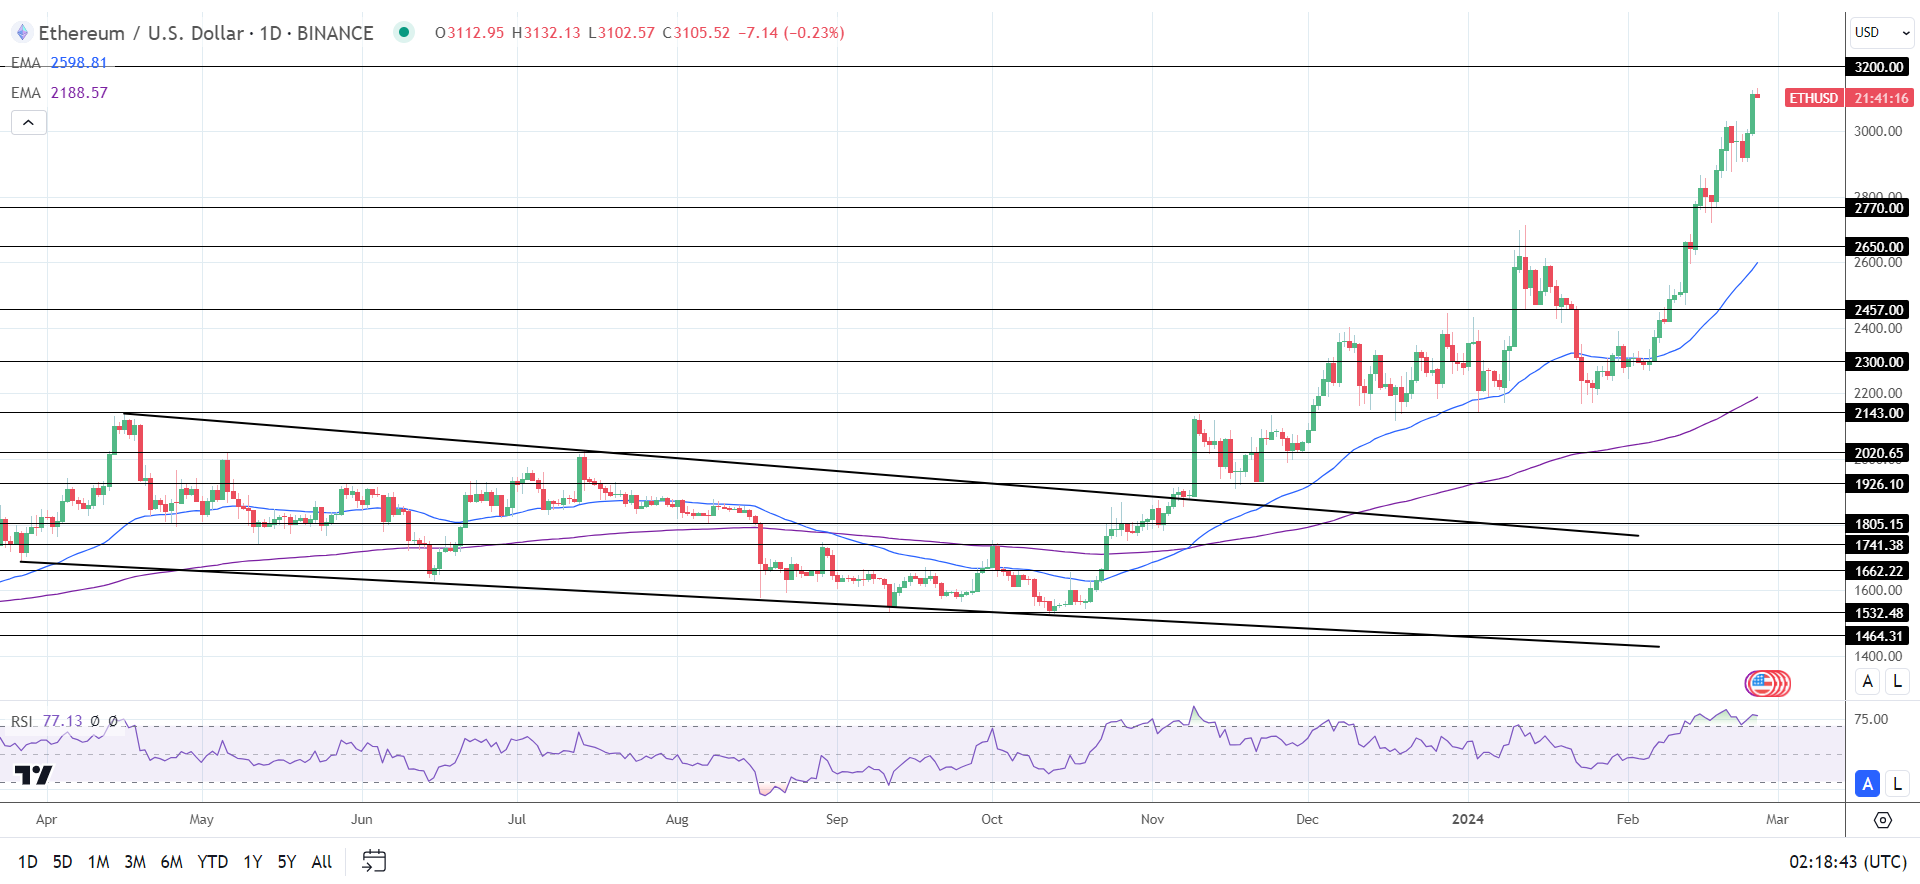
In contrast to the BTC pullback, ETH continued to rally on bets the SEC will approve the first batch of ETH-spot ETFs in May. ETH ended the Sunday session up 3.99% to $3,113. Significantly, ETH held onto the $3,100 handle for the first time since April 10, 2022.
While BTC has gained 20.71% in February, ETH is up 36% in February.
On Thursday, February 22, Coinbase (COIN) sent a letter to the SEC arguing for an ETH-spot ETF market. Coinbase responded to the SEC’s request for public comment on the Grayscale Ether Trust.
Further issuer and SEC activity needs consideration on Monday.
Technical Analysis
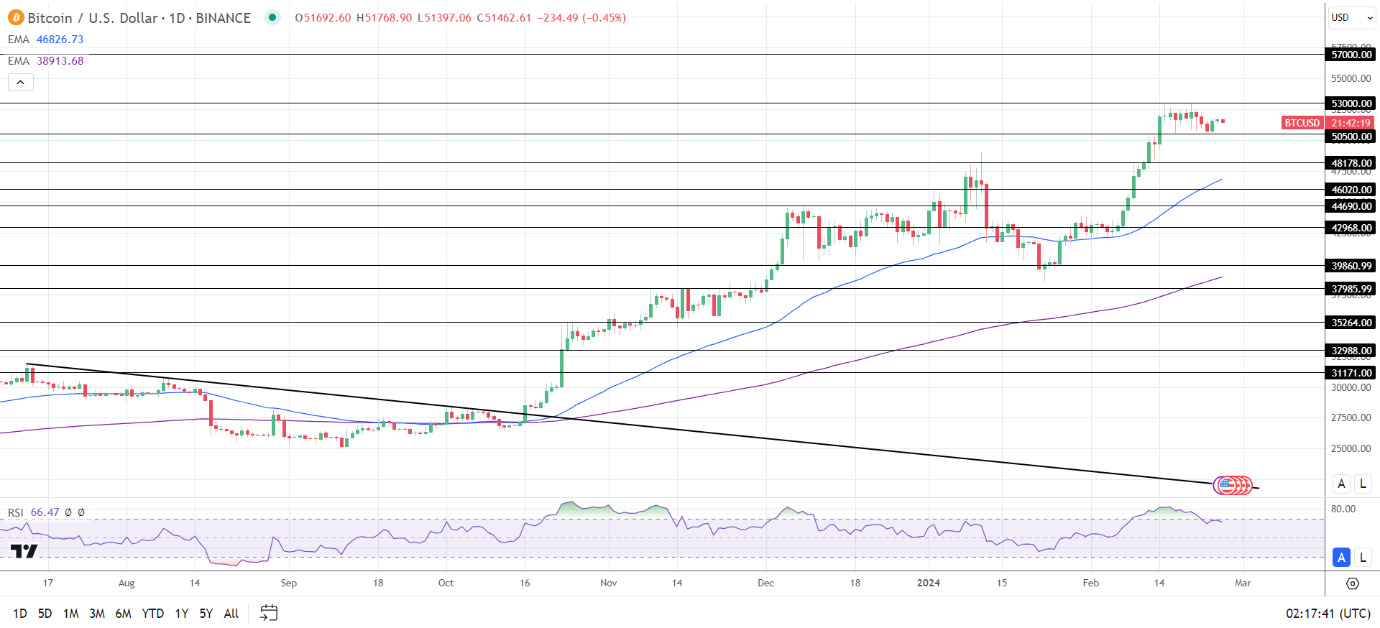
Bitcoin Analysis
BTC remained well above the 50-day and 200-day EMAs, sending bullish price signals.
A BTC break above the $52,500 handle would support a move to the $53,000 resistance level and the Tuesday high of $53,026.
BTC-spot ETF market flow data needs consideration.
However, a break below the $50,500 support level would give the bears a run at the $48,178 support level.
The 14-Daily RSI reading, 66.47, suggests a BTC move to the $53,000 resistance level before entering overbought territory.
BTCUSD 260224 Daily Chart
Ethereum Analysis
ETH sat well above the 50-day and 200-day EMAs, affirming bullish price signals.
An ETH break above the Monday morning high of $3,132 would bring the $3,200 resistance level into play.
Gold managed to stay above the key $2000 level despite rising Treasury yields.
Strong demand from central banks provided significant support to gold markets.
Investment demand for gold should rise when Fed starts cutting rates.
Gold Stays Above $2000 Despite Changes In Fed Policy Outlook
Recent inflation data and Fed’s comments have led to material changes in Fed policy outlook.
FedWatch Tool indicates that there is a 63.9% probability that Fed will leave the interest rate unchanged at the meeting in May. Traders expect that Fed will start cutting rates in June.
Not surprisingly, the changes in Fed policy outlook pushed Treasury yields away from multi-month lows. Currently, the yield of 2-year Treasuries settled near the 4.65% level, while the yield of 10-year Treasuries climbed towards 4.30%.
Rising Treasury yields are bearish for gold and other precious metals that pay no interest. Gold made an attempt to settle below the psychologically important $2000 level but this pullback was quickly bought. From a big picture point of view, gold continues to consolidate above $2000 after the test of all-time highs in December 2023. What is driving demand for gold?
Central Banks Keep Buying Gold
The recent data indicates that central banks were actively buying gold for reserves in 2023. Geopolitical uncertainty was the key driver for central bank demand.
Gold is the only reserve asset that is fully controlled by the holder, so it’s not surprising to see that central banks want to increase the share of gold in their reserves.
Importantly, gold managed to stay above the $2000 level despite outflows in gold ETFs, highlighting the strength of the core demand for gold holdings.
Most likely, rising demand for gold from central banks will be a multi-year trend. Geopolitical tensions are rising year after year, so central banks have no choice but to diversify their holdings and increase the share of gold in their portfolios.
In the near term, AI hype and strong crypto markets may serve as negative catalysts for gold markets as investors rush into riskier assets. In the second half of the year, when Fed starts cutting rates, investment demand for gold would likely increase, pushing gold towards new highs.
For a look at all of today’s economic events, check out our economic calendar.
The DAX gained 0.27% on Friday, closing the session at 17,419.
Economic indicators from Germany signaled a worsening economic backdrop.
On Monday, central bank chatter warrants investor attention, with ECB President Lagarde on the calendar to speak amidst bets on an April ECB rate cut.
Overview of the DAX Performance on Friday
The DAX gained 0.27% on Friday. Following a 1.47% rally on Thursday, the DAX ended the session at 17,419. Significantly, the DAX reached an all-time high of 17,444.
An Economic Contraction and Business Sentiment in Focus
On Friday, the German economy was in the spotlight. The German economy contracted by 0.3% quarter-on-quarter in Q4, unchanged from the preliminary number.
Significantly, private consumption contributed positively in Q4, with the auto sector standing out from a gloomy manufacturing sector environment.
Despite the grim macroeconomic backdrop, business sentiment improved in February, albeit modestly. The Ifo Business Climate Index increased from 85.2 to 85.5. Economists forecast a reading of 85.5. Firms were less pessimistic about the economic outlook. However, business sentiment toward current conditions was unchanged.
US Market Session Signaled a Possible Top
The NVIDIA (NVDA) Effect failed to deliver a second breakout session. On Friday, the Nasdaq Composite Index declined by 0.28%. The Dow and S&P 500 ended the day up 0.16% and 0.03%, respectively.
There were no US economic indicators for investors to consider. The lack of data and Fed speakers left the Nasdaq in negative territory as investors locked in profits. Significantly, the DAX retreated from its all-time high, with tech stocks under pressure.
The Friday Market Movers
Auto stocks were among the front-runners for the third consecutive session. BMW and Porsche saw gains of 1.56% and 1.69%, respectively. Volkswagen ended the day up 1.31%, with Mercedes-Benz Group rising by 0.58%.
Bank stocks also ended the session in positive territory, with Standard Chartered reporting an 18% jump in pre-tax profits. The Asian-focused bank also announced a $1 billion share buyback. SCB shares gained 4.85% on Friday. Commerzbank and Deutsche Bank ended the session up 0.19% and 1.13%, respectively.
However, Allianz slid by 3.37% on an earnings miss, with BASF falling by 0.52%. Investors reacted to Q4 earnings and cost-cutting plans for 2024.
ECB President Lagarde in the Spotlight
On Monday, ECB President Christine Lagarde is on the calendar to speak. Unwavering commitment to leave rates higher for longer to tame inflation could impact DAX-listed stocks.
In recent speeches, ECB speakers have raised concerns about cutting rates too early. However, the macroeconomic environment continues to fuel expectations of an April ECB rate cut. Comments relating to the economic outlook, inflation, and the timeline to cut interest rates would move the dial.
There are no euro area stats for investors to consider. However, corporate earnings remain a focal point.
US Economic Calendar: Manufacturing, the Housing Sector, and Fed Speakers
US housing sector data and the Dallas Fed Manufacturing Index will draw investor interest on Monday. Economists consider US housing sector data to be leading indicators for the US economy. A deterioration in housing sector conditions could impact consumer confidence and spending. However, investors must consider trends, with inventory levels causing sizeable monthly swings.
The Dallas Fed Manufacturing Index could also move the dial. Cracks in the US economy could refuel bets on a May Fed rate cut. However, economists forecast the Dallas Fed Manufacturing Index to jump from -27.4 to -8.0 in February. In January, the Index fell to its lowest level since June 2023.
Beyond the numbers, investors must track FOMC member speeches. Reactions to the recent inflation reports and views on the timeline for a Fed rate cut need consideration.
Short-term Forecast
Near-term trends for the DAX remain hinged on ECB and Fed speeches. However, euro area and US inflation figures will impact market bets on H1 2024 ECB and Fed rate cuts. Softer inflation numbers and rising bets on rate cuts could deliver new highs.
On Monday, the DAX futures and Nasdaq mini were down 39 and 43 points, respectively.
DAX Technical Indicators
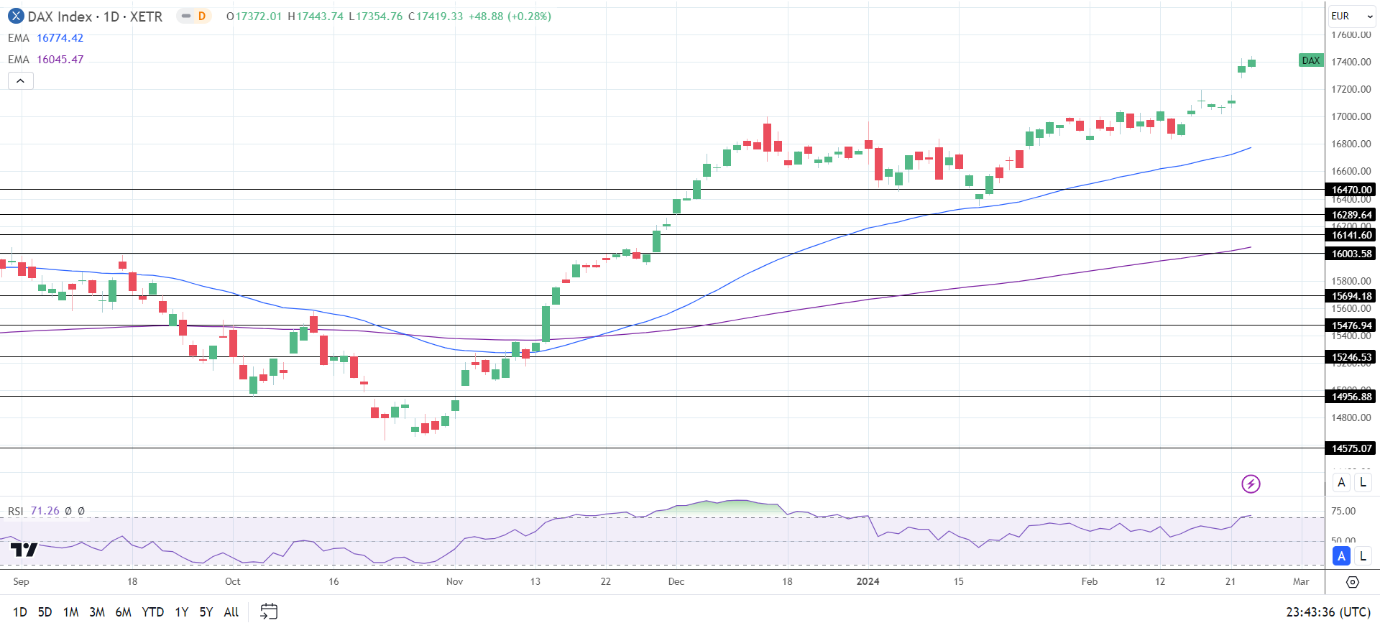
Daily Chart
The DAX sat well above the 50-day and 200-day EMAs, affirming the bullish price signals.
A DAX break above the Friday all-time high of 17,444 would support a move to the 17,500 handle.
Central bank commentary and US economic data need consideration.
A drop below the 17,350 handle would bring the 50-day EMA into view.
The 14-day RSI at 71.26 shows the DAX in overbought territory. Selling pressure could intensify at the ATH of 17,444.
DAX 260224 Daily Chart
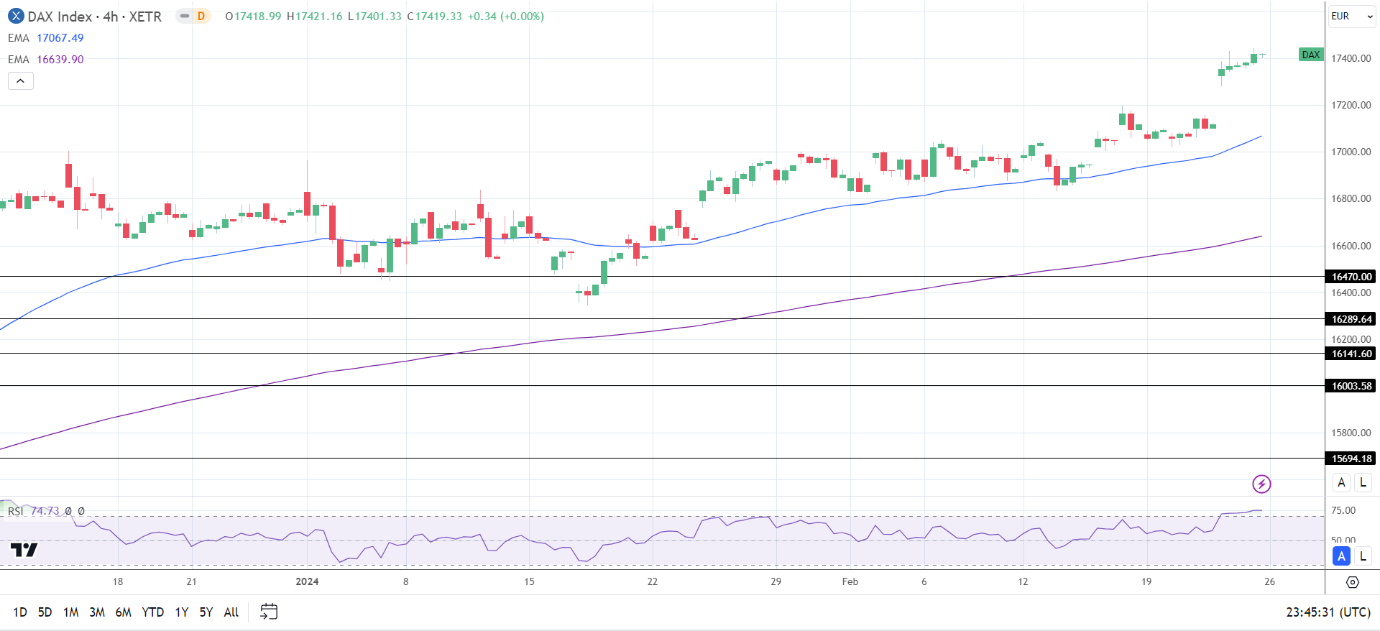
4-Hourly Chart
The DAX remained above the 50-day and 200-day EMAs, affirming the bullish price signals.
A DAX breakout from the 17,444 all-time high would give the bulls a run at 17,500.
However, a DAX drop through the 17,350 handle would bring sub-17,200 and the 50-day EMA into play.
The 14-period 4-hour RSI at 74.73 shows the DAX sitting in overbought territory. Selling pressure could intensify at the all-time high of 17,444.
TSMC expands to Japan amid U.S.-China tensions, diversifying supply chain.
Reddit’s IPO offer met with skepticism from users over “karma” concerns.
Buffett’s Berkshire faces growth slowdown, sits on record cash reserves.
AT&T offers $5 credit after nationwide network outage, promises prevention.
Samsung unveils Galaxy Ring with health-tracking features, enters smart ring market.
1. TSMC Expands to Japan Amid Rising U.S.-China Tensions
Taiwan Semiconductor Manufacturing Company (TSMC) inaugurates its first chip factory in Japan, seeking to diversify its supply chain away from Taiwan amid escalating U.S.-China trade tensions. As the world’s largest chip contract manufacturer, TSMC’s move reflects efforts to strengthen global supply chains and mitigate geopolitical risks. The Japanese facility, set to commence production by late 2024, signifies a strategic expansion for TSMC, supported by substantial investments from both the company and the Japanese government, aimed at fostering growth in Japan’s semiconductor industry. (CNBC)
Despite Reddit’s offer for users to invest in its IPO, many are hesitant to buy into the platform they’ve already contributed to for free. Moderators and power users express skepticism, citing Reddit’s history of losses and controversies. The company’s attempt to reward contributors may not yield the expected enthusiasm, potentially affecting its market debut. As Reddit extends its IPO offer, users weigh the risks of investing in a platform they’ve long supported. (Wired)
3. Buffett’s Berkshire: Growth Forecast Hits a Pile of Cash
Warren Buffett’s cautionary words signal the end of Berkshire Hathaway’s explosive growth era, citing limited investment options and record-high cash reserves. Despite past transformative deals, Buffett acknowledges the scarcity of opportunities both in and outside the US, with the conglomerate’s $167.6 billion cash pile overshadowing recent acquisitions. As Buffett’s successors prepare to navigate Berkshire’s future, they face the daunting task of maintaining stability amid dwindling prospects for remarkable gains. (Reddit)
4. AT&T Offers $5 Credit After Nationwide Network Nightmare
AT&T extends a $5 credit to affected customers following a nearly 12-hour network outage. The telecom giant acknowledges the inconvenience caused, promising preventive measures for future incidents. While investigations continue, AT&T assures the outage stemmed from an internal error during network expansion, ruling out cyber threats. As regulators scrutinize the incident, AT&T emphasizes its commitment to safeguarding network reliability. (CNN)
5. Ring in the Future: Samsung’s Health-Tracking Bling
Samsung unveils its Galaxy Ring, a wearable packed with health-tracking features, marking the tech giant’s entry into the smart ring market. The device offers vital stats like heart rate and sleep patterns, complemented by a “vitality score” to gauge readiness. As Samsung embraces AI for deeper health insights, the Ring hints at a future where digital assistants coach users toward better health. With potential for contactless payments and more, the Ring aims to dazzle in the evolving wearable landscape. (CNBC)
(Reuters) – Beleaguered bitcoin miners are finally feeling the spring sunshine after a cold, hard crypto winter.
The power-hungry companies that pump new bitcoin into circulation have been thrown a lifeline by the cryptocurrency’s rally to above $30,000 this year, which has conspired with falling electricity prices to boost their profitability.
The 30-day average of mining revenues has risen to $27.34 million a day, the highest level since last June, according to data from Blockchain.com.
That’s a relief for miners that struggled to service large debt burdens as revenues languished between $15 million and $21 million for most of the second half of 2022. They’re still some way off a peak of $61.2 million hit in November 2021, though.
“Many public miners were on the brink of bankruptcy at the end of last year. At the current bitcoin price, these companies’ cash flows have substantially improved and most of them should have no problem paying their obligations,” said Jaran Mellerud, analyst at bitcoin mining services company Luxor.
Miners’ debt-to-equity ratios now look much healthier, said Mellerud, adding that many companies had restructured and paid down debt over the past few months.
Marathon Digital Holdings’ debt-to-equity ratio has dropped to 0.5 from 2 since the start of this year, for example, while Greenidge Generation Holdings’ has dropped to 5.8 from 11.7, according to data from Luxor.
The spring thaw has seen investors flock back to publicly traded crypto mining companies; Among the biggest players, Marathon and Riot Platforms have seen their share price more than triple this year, while the Valkyrie Bitcoin Miners ETF is up 162% and Greenidge has gained 137%. But they’ve all still lost money since early 2022.
Bitcoin mining is the process by which a network of computers validates a block of transactions on the blockchain. Miners are rewarded with bitcoin for completing a block, competing against other miners by solving intricate maths puzzles with energy-intensive computing systems, meaning electricity comprises a significant chunk of their operating costs.
Declines in power prices, particularly in the U.S., have eased pressure on company margins, according to analysts at BTIG, who said the electricity cost for producing one bitcoin has fallen about 40% from the end of last year.
That means that despite both the computing power available on the network and mining difficulty rising steadily to new all time highs – meaning it should take more power to mine one block – the 30-day average cost-per-transaction for miners has fallen to its lowest level since September, Blockchain.com data showed.
(Graphic: Robust growth in revenue – https://www.reuters.com/graphics/FINTECH-CRYPTO/WEEKLY/klpygmobapg/chart.png)
OUT OF THE WOODS?
Miners can’t get too cozy though, given their fortunes are tied to bitcoin’s capricious price trajectory.
“If we see bitcoin top out and consolidate, the run-up in miners may do the same, we expect to see more volatility as we head into summer,” said Kevin Kelly, head of research at Delphi Digital, although he sees a favorable environment for crypto persisting through 2023, compared with last year.
Despite improvements in their balance sheets, many miners still have plenty of debt to pay down and are still struggling, said Luxor’s Mellerud.
“The bitcoin price increase has bought these companies time, but it would be detrimental for these companies if it were to fall back down to $20,000,” he said.
Most companies are focusing on debt reduction rather than spending on new equipment, BTIG said, even as the estimated cost of new mining rigs has dropped around 69% since the end of 2021.
There are some exceptions however, with CleanSpark taking advantage of falling prices to purchase of 45,000 new mining rigs, which would nearly double its computing power.
A rapid rise in power prices or a fast fall in bitcoin could usher in a new cold spell. For now though, the sun is shining.
“I don’t think we’re completely out of the woods, but I think the worst is behind us,” said Marcus Sotiriou, analyst at digital asset broker GlobalBlock..
(Reporting by Lisa Pauline Mattackal and Medha Singh in Bengaluru; Editing by Vidya Ranganathan and Pravin Char)
NEW YORK/LONDON (Reuters) – The dollar rose on Monday after New York state factory activity in April increased for the first time in five months, helping bolster expectations the Federal Reserve will raise interest rates in May.
Also bolstering the dollar was a report showing confidence among U.S. single-family homebuilders improved for a fourth straight month in April.
The dollar index, a measures of the currency against six major peers, rose 0.413% after the Empire State Manufacturing index shot to 10.8 from -24.6 in March, far higher than expectations of -18 in a Reuters poll of 35 economists.
The new orders index rose 47 points to 25.1, while the shipments index added 37 points to 23.9, substantial increases after they had declined in recent months, the New York Fed said.
“It’s the best reading since last July with a big jump in orders and has taken the dollar higher on this,” said Marc Chandler, chief market strategist at Bannockburn Global Forex in New York.
“The economy still looks like it’s growing above what the Fed says is its speed limit,” he said. “The market is under-estimating chances of another hike after May. Now the market says the Fed is going to cut later, but I think that the economy is showing itself to be resilient.”
GRAPHIC: Empire State https://www.reuters.com/graphics/USA-STOCKS/zdvxdawervx/empirestate.png
Futures trading showed the probability of the Fed raising its lending rate to a range of 5.00%-5.25% when policymakers conclude a two-day meeting on May 3 rose to 88.7% from 78% on Friday, CME Group’s FedWatch Tool showed.
Fed funds futures also showed that expectations the Fed will start cutting rates later this year were pushed back to November from September, with a smaller cut now anticipated.
The outlook of U.S. interest rates relative to the monetary policies and economies of other countries can boost or erode the dollar’s value.
The euro slid 0.66% to $1.0926 after hitting a one-year high of $1.108 on Friday. Traders expect further interest rate hikes from the European Central Bank as last month’s banking crisis fears have faded.
The yen weakened 0.45% at 134.40 per dollar as the Bank of Japan stuck to its easy-money policies, helping the greenback rise to its highest level since March 15.
“The dollar has bounced back but also we’ve had comments from the Bank of Japan indicating that there is no real reason for them to pull back from their ultra easy policy,” said Jane Foley, head of FX strategy at Rabobank.
New Bank of Japan Governor Kazuo Ueda last week made clear that the country would remain a “dovish” outlier by keeping interest rates at ultra-low levels for the time being.
GRAPHIC: Dollar hits one-month high against yen https://www.reuters.com/graphics/GLOBAL-FOREX/jnpwylzabpw/chart.png
Sterling was last trading at $1.2374, down 0.31% on the day.
The Mexican peso lost 0.11% versus the dollar to trade at 18.04, while the Canadian dollar fell 0.25% versus the greenback to 1.34 per dollar.
(Reporting by Herbert Lash, additional reporting by Harry Robertson in London; Editing by Muralikumar Anantharaman, Mark Potter and Andrea Ricci)
NEW YORK (Reuters) – The head of the U.S. Securities and Exchange Commission (SEC) plans to defend its rulemaking and policing of market misconduct at a Tuesday hearing led by Republican lawmakers who have accused it of overstepping its authority.
Having won control of the House of Representatives last year, Republicans now have a pulpit to try to constrain President Joe Biden’s administrative oversight of key financial issues. Some in the finance industry have joined in the criticism, saying the SEC is going too far in its reforms and not taking time for industry feedback.
But SEC Chair Gary Gensler, who has helmed the agency since April 2021, underscored the agency’s rulemaking work as “grounded in legal authorities granted by Congress” in testimony prepared for Tuesday’s House Financial Services Committee hearing.
The SEC has proposed a stock market overhaul and laid out plans to require companies to disclose climate-related risks, among numerous other reforms.
“Forsaking investor protection puts real people’s life savings at risk. The goal is to protect our ‘clients’: U.S. investors,” he said in the prepared remarks.
But the U.S. Chamber of Commerce, which represents businesses, in a letter last week said the agency’s rulemaking under Gensler is “torrential, disjointed and rushed.”
Republican SEC Commissioner Hester Peirce has also criticized the agency’s agenda and engagement with industry.
“Today’s Commission treats the notice-and-comment rulemaking process not as a conversation, but as a threat,” she said at a public meeting to discuss a proposed reform that could usher in major change for cryptocurrency firms.
The SEC has also actively policed market misconduct, levying record penalties in the last fiscal year.
Progressive lawmakers and investor advocates have praised the SEC and pushed for Congress to give the agency more resources.
The “SEC is making significant progress in its mission to protect investors and maintain fair, orderly, and efficient markets,” Stephen Hall, legal director and securities specialist at Better Markets, said in a statement.
(Reporting by Chris Prentice; Editing by Aurora Ellis)
(Reuters) – Celebrities who promoted FTX, including NFL quarterback Tom Brady and comedian Larry David, said an investor lawsuit seeking damages in the wake of the cryptocurrency exchange’s collapse should be dismissed.
The proposed class action in Miami alleges that FTX yield-bearing accounts were unregistered securities that were unlawfully sold in the United States, which required the promoters to disclose the compensation they received.
The lawsuit seeks damages from FTX founder Sam Bankman-Fried alongside several celebrities who promoted FTX including David, the creator of TV shows “Seinfeld” and “Curb Your Enthusiasm.” It also seeks damages from a National Basketball Association team that promoted FTX, the Golden State Warriors.
The celebrities and the Warriors said in court papers filed on Friday that they had never pitched the accounts at issue in the case and did not cause the investors’ losses.
They said that under the investors’ theory, “actors in any brokerage ad would be liable for selling any security that an individual user later purchased using the brokerage’s services.”
“That’s nonsense,” the celebrities said.
A lawyer for the investors did not immediately reply to a request for comment.
David starred in a commercial for FTX that aired during the 2022 Super Bowl in which he portrayed fictional characters dismissing important innovations throughout history and ended with the message “Don’t Miss Out on Crypto.”
Bankman-Fried argued in court papers that the case against him should be paused while he fights criminal charges in New York. The investors did not oppose the request, he said.
Prosecutors have charged Bankman-Fried, 31, with stealing billions of dollars in FTX customer funds to plug losses at Alameda Research, and making tens of millions of dollars in illegal political donations to buy influence in Washington, D.C. He has pleaded not guilty.
The case is Garrison v. Bankman-Fried et al., No. 22-23753, U.S. District Court, Southern District Of Florida.
(Reporting by Jody Godoy in New York; Editing by Matthew Lewis)
(Reuters) – The U.S. Securities and Exchange Commission charged cryptocurrency exchange Bittrex Inc and its former CEO with operating an unregistered national securities exchange, broker and clearing agency.
The SEC also charged Bittrex’s foreign affiliate, Bittrex Global GmbH, for failing to register as a national securities exchange in connection with its operation of a single shared order book along with Bittrex.
(Reporting by Hannah Lang in Washington, Editing by Franklin Paul)
NEW YORK (Reuters) – The U.S. Securities and Exchange Commission (SEC) on Friday will weigh reopening a 2022 proposal that would expand the definition of an “exchange” following pushback from the cryptocurrency industry which fears being ensnared.
The commissioners are expected to take a rare public vote on whether to ask for more comments from the public on the plan. Crypto firms have questioned whether the changes would cover their industry, including decentralized finance, or DeFi, platforms.
The regulator’s January 2022 proposal would expand the definition of an exchange to include platforms that use “communication protocols” such as request-for-quote systems. The change, if adopted, is expected to capture many more venues beyond traditional exchanges that bring together orders from multiple buyers and sellers in a marketplace.
Typically, commissioners would decide behind-the-scenes if extending a public comment period is necessary.
The proposal has stoked already rising tensions between the crypto industry and the SEC. Crypto firms, which have complained about the SEC’s failure to provide regulatory certainty for their industry, said the proposal was vague and would give the SEC a tool to pull Defi platforms within its oversight.
Some DeFi platforms may fall under the proposed definition, but others may already be considered exchanges by the existing definition, SEC officials said this week.
The officials estimated about dozen crypto firms would fall under the expanded definition, but declined to provide any more specifics about which firms.
“Make no mistake: many crypto trading platforms already come under the current definition of an exchange,” SEC Chair Gary Gensler said in prepared remarks published on Friday.
Most crypto trading platforms meet that definition, regardless of whether they call themselves decentralized, Gensler said.
The SEC plans to give more information on what trading systems for crypto securities would be included in the proposed definition.
(Reporting by Chris Prentice; Additional reporting by Hannah Lang; Editing by Sharon Singleton)


 In the last 40 days, Solana’s price story became even more volatile, with significant price movements and trading volumes. Starting at $93.58 in January 2024, it faced a notable sell-off, dropping below the Green Range to $83.64. Despite the fluctuations, Solana managed to climb back, peaking at $115.66 within the Orange Range in February. This period was marked by a recovery from previous drops but showcased the asset’s volatility.
 The last 3 days have been particularly dynamic for Solana, with the price moving through different ranges and marked by significant volume spikes. Starting at $109.18, Solana experienced a surge to $114.23, breaking above the blue range. It then entered the orange range, peaking at $115.14, before closing the period at $117.49, above the orange range. This short period highlighted Solana’s resilience and strong buying interest.
 Throughout these periods, Solana demonstrated a volatile yet upward trajectory, breaking through resistance levels and occasionally falling back to test support within the designated ranges. The volume spikes accompanying significant price changes highlight moments of heightened trading activity, reflecting the market’s reaction to evolving dynamics. The current RSI value of 70.96 suggests that Solana might be entering overbought territory, which could lead to a potential pullback. However, the asset’s ability to recover and push through resistance levels indicates a bullish sentiment among investors.


 In the more granular view of the last 40 days, Ethereum demonstrated significant volatility but managed to recover from sharp declines, showcasing resilience. The asset broke above the green and blue ranges, indicating strong buying interest and bullish momentum. This period was marked by crucial moments of resistance breakouts and support level tests, underscoring the dynamic nature of the cryptocurrency markets. ![40 Days Analysis]
 The last 3 days have been particularly volatile for Ethereum, with the asset testing support and resistance levels within the Green and Blue ranges. Significant volume spikes correlated with key price movements, highlighting the market’s reactive nature to these predefined ranges. Despite a sharp correction, Ethereum managed to recover, closing slightly above the Blue range. This period showcases Ethereum’s volatility and the traders’ quick reactions to market movements. ![3 Days Analysis]
 Overall, Ethereum’s performance over these periods paints a picture of a cryptocurrency with strong bullish momentum, capable of overcoming volatility and resistance levels. The RSI values, particularly the high of 84.32 in the 120-day analysis, indicate overbought conditions, suggesting that Ethereum has been in high demand. However, traders should be cautious of potential corrections following such rapid ascents.