
Key Points:
- Strengthened dollar and high U.S. inflation fears prompt oil price decline, complicating rate cut expectations.
- Natural Gas surges 5.65% to $1.7760, bullish above pivot point $1.7333, with resistance up to $1.9291.
- UK Oil dips to $81.30, bearish below pivot $81.93, despite potential support at $80.67 and lower.

In this article:
-
Natural Gas
-0.40%
-
WTI Oil
-0.36%
-
Brent Oil
-0.31%
Oil Dips as Strong Dollar and Rate Cut Speculations Weigh on Market
Oil prices saw a decline on Monday, continuing from the previous session’s drop as the dollar strengthened due to concerns that persistently high U.S. inflation might postpone anticipated cuts in U.S. interest rates. This fall in prices adds to the previous week’s downturn, driven by the likelihood of delayed U.S. rate cuts.
The stronger dollar, which makes oil more expensive for non-dollar currency holders, and a mix of geopolitical tensions and fluctuating demand forecasts, particularly from China, influenced the market.
Goldman Sachs has adjusted its peak summer price projection for Brent upwards, expecting a demand growth, notably from the U.S. and India, balanced against robust non-OPEC supply growth.
Meanwhile, geopolitical tensions and negotiations in the Middle East continue, with potential impacts on energy supplies and prices.
Natural Gas Price Forecast
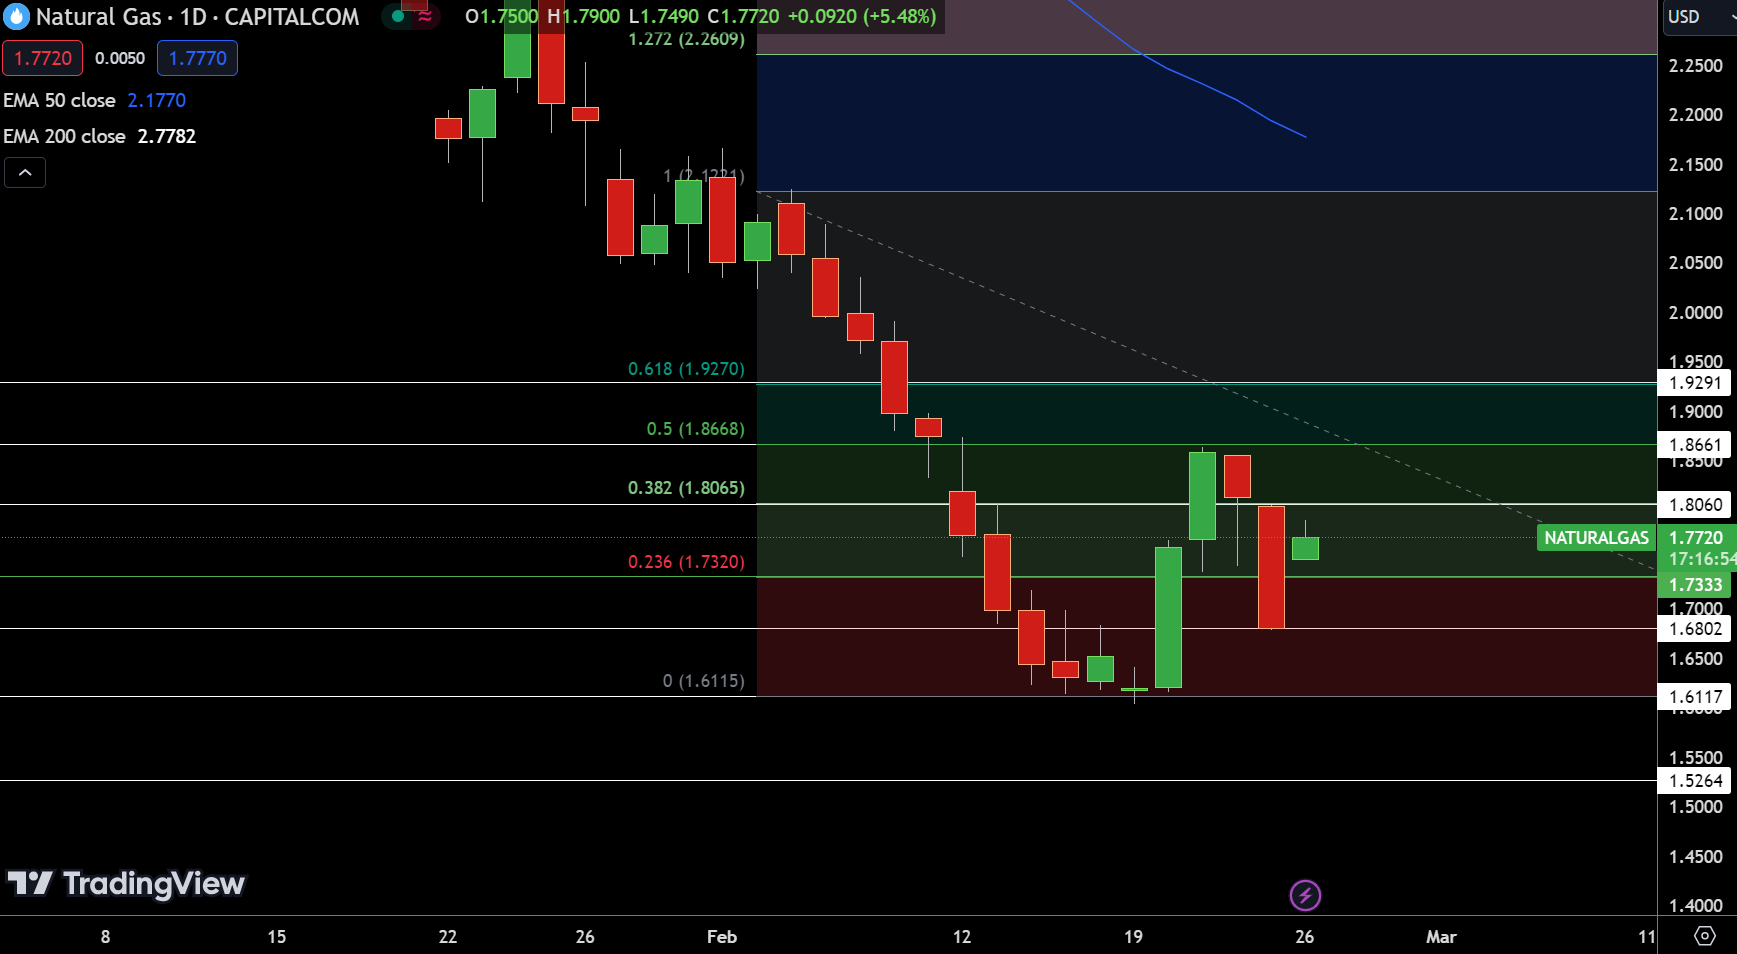
Natural Gas Price ChartNatural Gas (NG) experienced a notable surge, climbing 5.65% to $1.7760 in today’s 4-hour trading session. This movement places NG above its pivot point at $1.7333, indicating bullish momentum. Resistance levels are identified at $1.8060, $1.8661, and $1.9291, marking potential targets for upward movement.
Conversely, support levels are established at $1.6802, followed by $1.6117 and $1.5264, which could offer stabilization in case of a retracement. The 50-day Exponential Moving Average (EMA) at $2.1770 and a much lower 200-day EMA at $0.54880 underscore the volatility and upward potential in NG prices.
The overall trend appears bullish above the $1.7333 mark, suggesting a continuation of the upward trajectory if this level holds.
WTI Oil Price Forecast

WTI Price Chart
Resistance levels are set at $77.56, $78.89, and $80.10, indicating potential hurdles for upward movements. Conversely, support is found at $75.50, with further floors at $74.55 and $74.19, which could stabilize any declines. The 50-day Exponential Moving Average (EMA) at $77.22 and a notable 200-day EMA provide context for the current price action.
A breakout below the $76.50 level could signal a bearish trend, hinting at further declines if sustained. The technical outlook suggests a cautious approach, with a bearish sentiment prevailing below the pivot point of $76.49.
Brent Oil Price Forecast
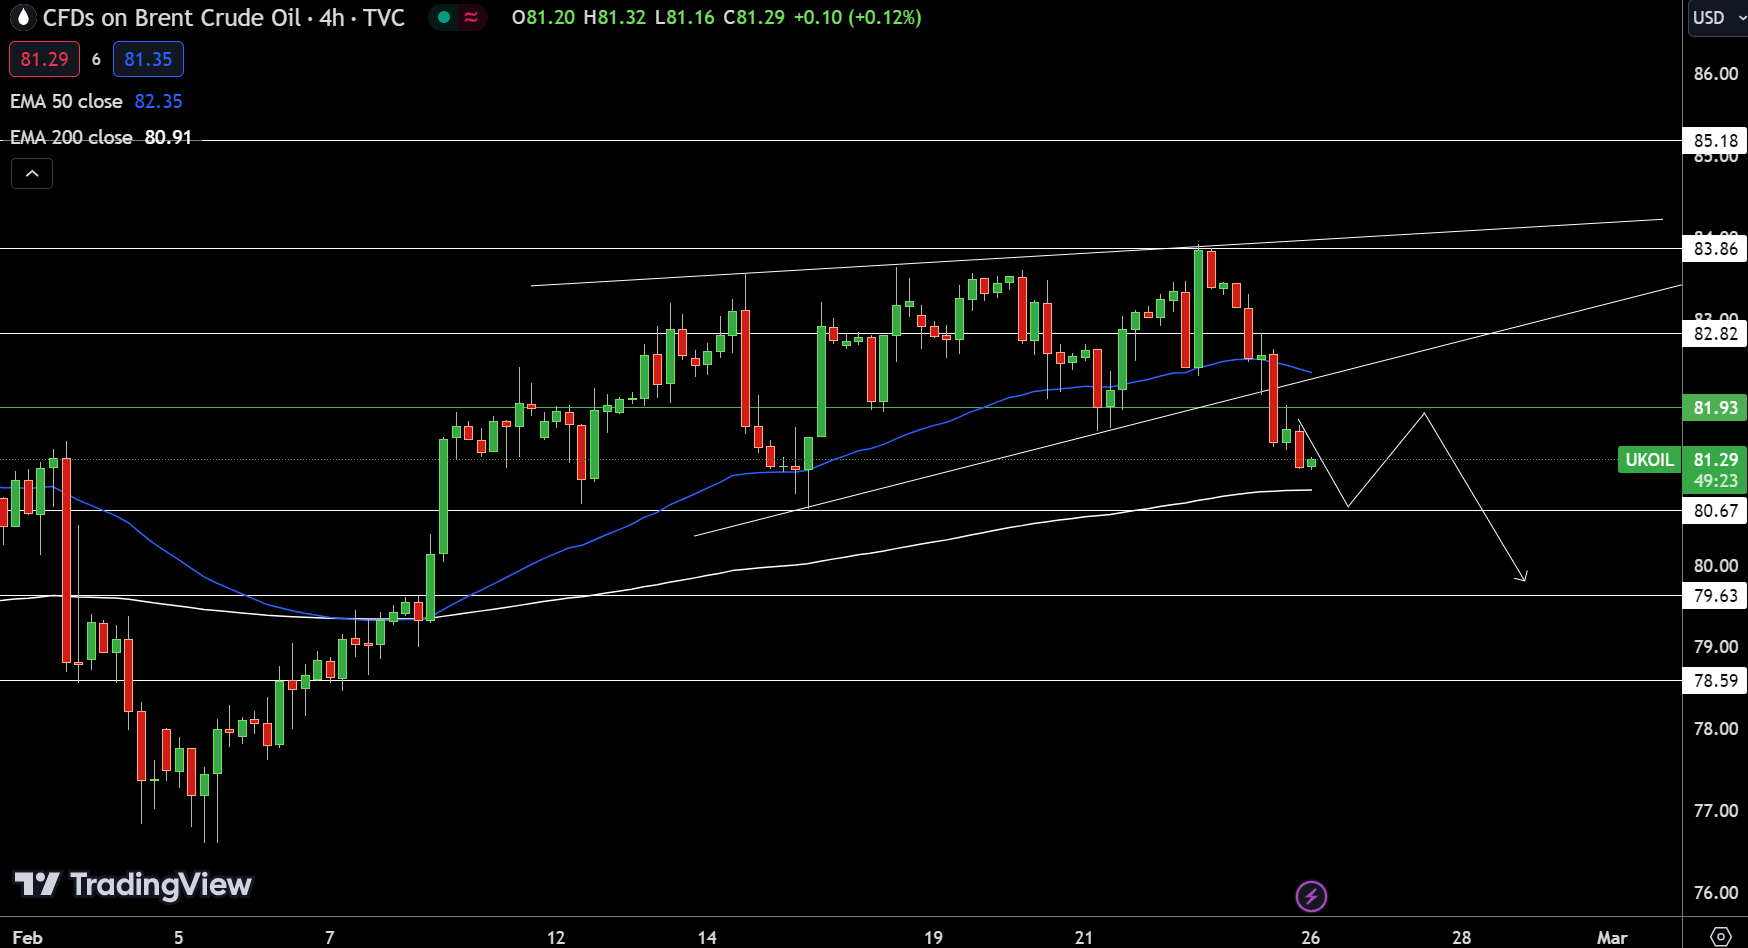
UKOIL Price Chart